| (19.4.3) | |||
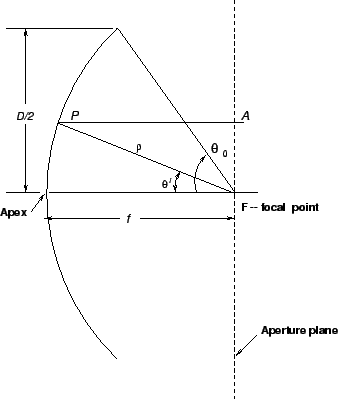
Reflector antenna radiation patterns are determined
by a number of factors, but the most important ones are the radiation
pattern of the feed antenna and the shape of the reflector. Parabolic
reflectors have the unique feature that all path lengths from the
focal point to the reflector and on to the aperture plane are the same.
As shown in Figure 19.1,
 |
When the reflector dimensions are large compared to the wavelength, geometrical optics principles can be used to determine the power distribution in the aperture plane. If the feed pattern is azimuthally symmetric, then the normalized far-field radiation pattern of reflector depends on
| (19.4.4) |
| (19.4.5) |
In Chapter 3 we saw that the far field is in general the Fourier transform of the aperture plane distribution. In the case of azimuthally symmetric distributions, this can be written as
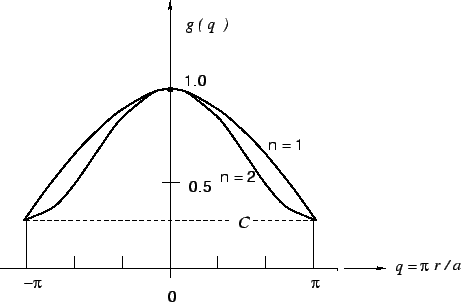
The aperture illuminations corresponding to different values of
the parameter ![]() are shown in Figure 19.2. The case
are shown in Figure 19.2. The case ![]() corresponds to a uniform aperture distribution.
corresponds to a uniform aperture distribution.
 |
For uniform illumination the far field pattern is given by
Simple closed-form expressions are available for integer values of ![]() . If
the above expression
. If
the above expression ![]() is denoted as
is denoted as ![]() , (since
, (since ![]() ) the
general form for any integer
) the
general form for any integer ![]() is given by
is given by
Table 19.1 gives the halfpower beamwidth (HPBW), the
first sidelobe level and the taper efficiency (see Section 19.4.1)
for various edge tapers ![]() and shape parameter
and shape parameter ![]() .
.
| Edge Taper | |||||||
| HPBW | Sidelobe | HPBW | Sidelobe | ||||
| (dB) | C | (rad.) | level (dB) | (rad.) | level (dB) | ||
| -8 | 0.398 |
|
-21.5 | 0.942 |
|
-24.7 | 0.918 |
| -10 | 0.316 |
|
-22.3 | 0.917 |
|
-27.0 | 0.877 |
| -12 | 0.251 |
|
-22.9 | 0.893 |
|
-29.5 | 0.834 |
| -14 | 0.200 |
|
-23.4 | 0.871 |
|
-31.7 | 0.792 |
| -16 | 0.158 |
|
-23.8 | 0.850 |
|
-33.5 | 0.754 |
| -18 | 0.126 |
|
-24.1 | 0.833 |
|
-34.5 | 0.719 |
From Table 19.1 (see also the discussion in
Chapter 3) we find that as the edge-taper parameter ![]() decreases,
the HPBW increases, the first sidelobe level falls and the taper-efficiency
also decreases. Note that
decreases,
the HPBW increases, the first sidelobe level falls and the taper-efficiency
also decreases. Note that ![]() has to be less than unity since we have assumed
a radiation pattern which decreases monotonically with increasing angle from
the symmetry-axis (Eqn 19.4.6, Fig 19.2).
has to be less than unity since we have assumed
a radiation pattern which decreases monotonically with increasing angle from
the symmetry-axis (Eqn 19.4.6, Fig 19.2).